Supply-and-demand graphs are all well and good, but in some situations there is more to the story. This post covers markets where the quantity of a good affects the demand.
Imagine you are the first person on the planet to buy a telephone. As far as talking with other people goes, the phone is worthless. You'd be better off playing checkers with yourself.
But now that you have a phone, if someone else buys a phone, he will have someone to talk to. The benefits of a phone have risen. As more and more people buy phones, the benefits of a phone rise higher and higher. This is called a network effect.
Network effects aren't the end of the story. But let me change the example- the use of the same computer operating system has network effects, and so, as more people adopt Microsoft, it causes more people to adopt, until Microsoft has a near-monopoly. Now that Microsoft is widespread, let's say a better operating system comes along -- Apple. Because it's better than Microsoft, it would usually be adopted. But, thanks to the network effects, it may actually be better for each individual to keep using Microsoft. Microsoft, with widespread use, is better than Apple without widespread use. Since no one ever uses Apple, it can't build up the network effect, and people stay with Microsoft- the poorer system. It is collectively rational to switch systems, but it is individually rational to stick with Microsoft. This is called path dependency.
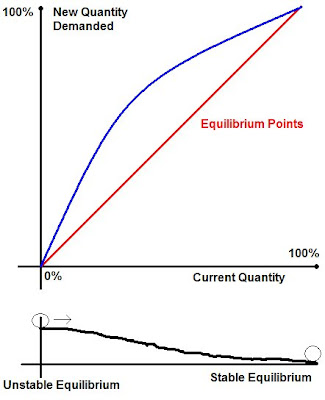
When variables interact with each other like this, there is no one economic optimum that can be found with a supply-and-demand graph. A more appropriate graph looks like this:
 The blue curve represents the demand given a certain percentage of adoption. So, for example, if the curve represented cell phone demand, and 50% of the population has a cell phone, about 75% would want one (50% already have one, and 25% go out and buy one).
The red curve represents all the equilibrium points. These are the points where the current quantity is the same as the desired quantity, so, once a society reaches one of these points, there are no further changes.
The demand will move along the blue curve until it hits an equilibrium point on the red curve. In this case, where there are positive network effects, the demand would increase until it intersects with the red curve at 100%. (If there were negative network effects, the blue curve would be below the red curve.) If we start at 10%, about 20% would be demanded, and we'd go from there to 50%, then to 75%, and so on to 100%.
0% is also an equilibrium point. It is unstable, however, because any deviation from 0%, however small, will launch demand back to 100%. The rolling balls below the graph represent this (yes, the circles are supposed to be rolling balls). The ball can balance precariously at 0%, but any small gust may start it rolling to 100%.
100% is stable, because small deviations lead back to 100%.
These effects, though irrelevant for much of economics, are more important for memetics.
No comments:
Post a Comment